What Work Do
Deportations
"Voluntary" Departures
Exclusions
Expulsions Do?
Deportation is just one tactic of immigration control. Explore the data visualizations below to delve deeper into the details of deportation as well as immigrant exclusion, punishment, and the informal process known as “voluntary departure.”
Data Library
For more information on our methodology please see our Sources page.
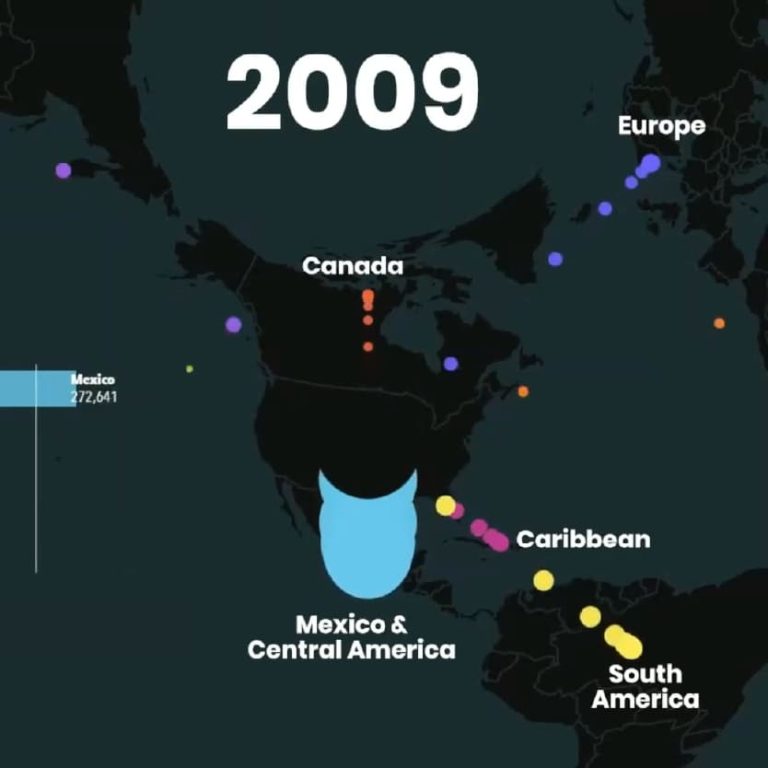
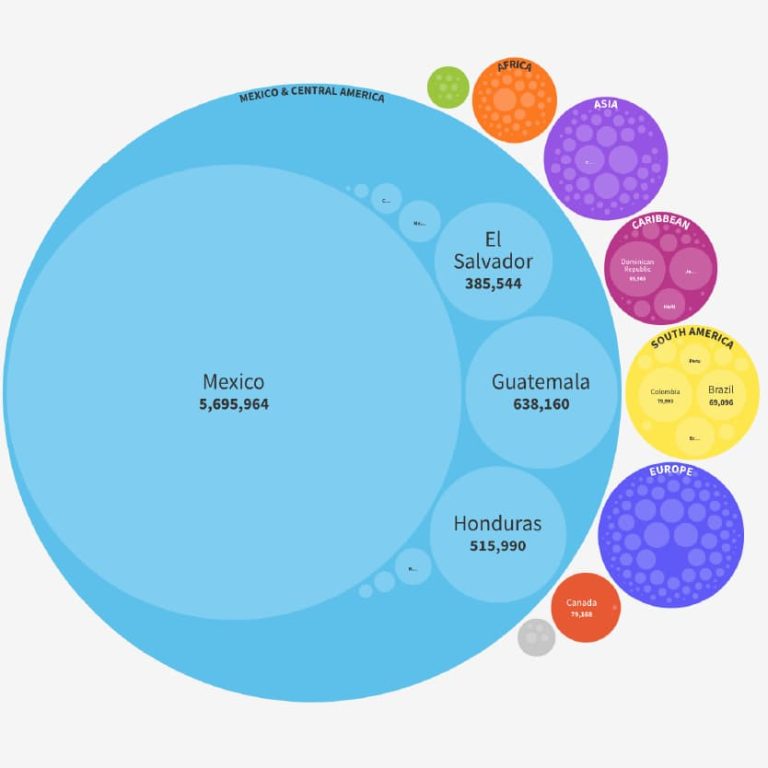
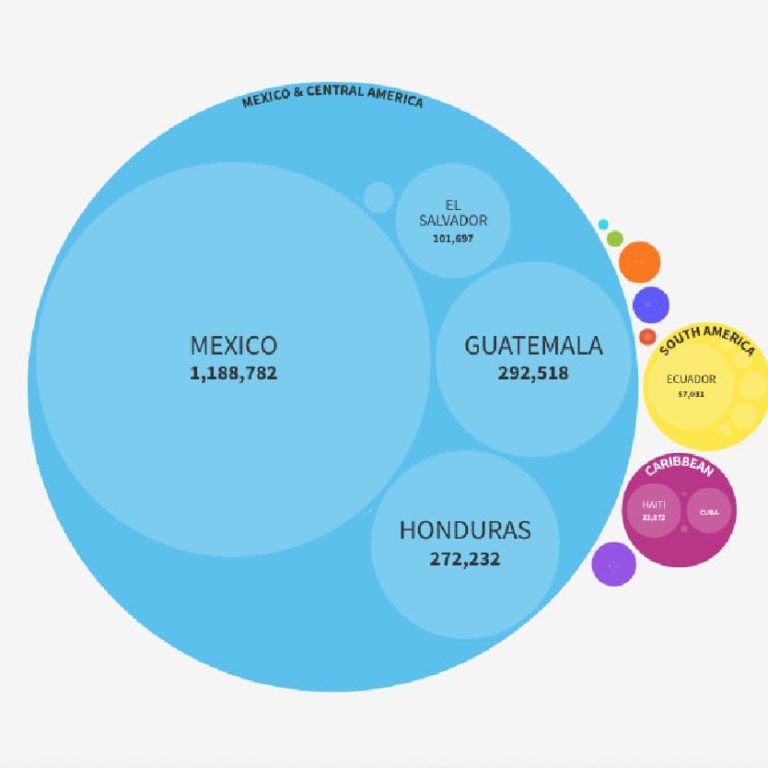
Who Gets Deported?
8 Million Deportations, 96% to Nonwhite-Majority Countries
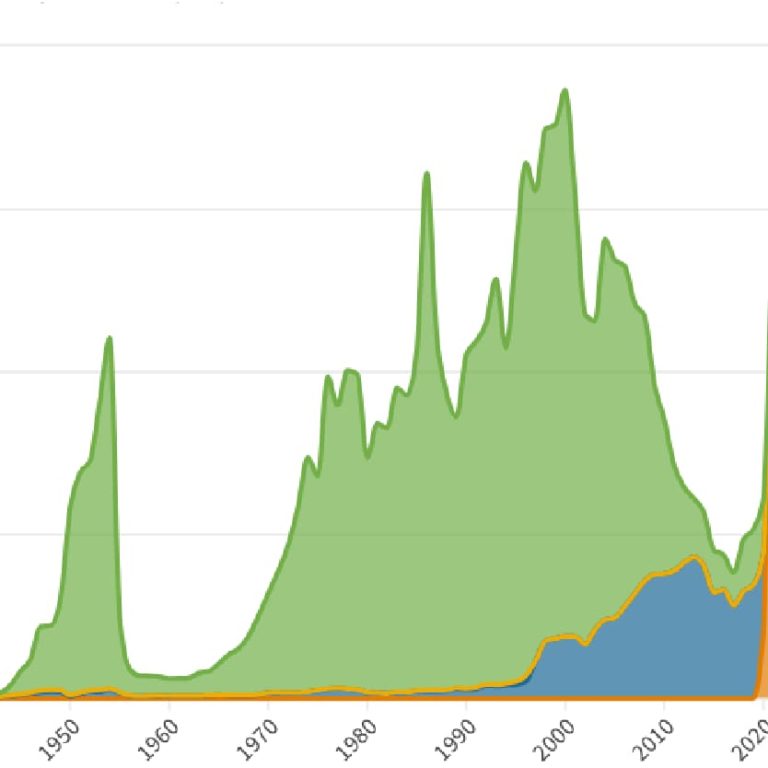
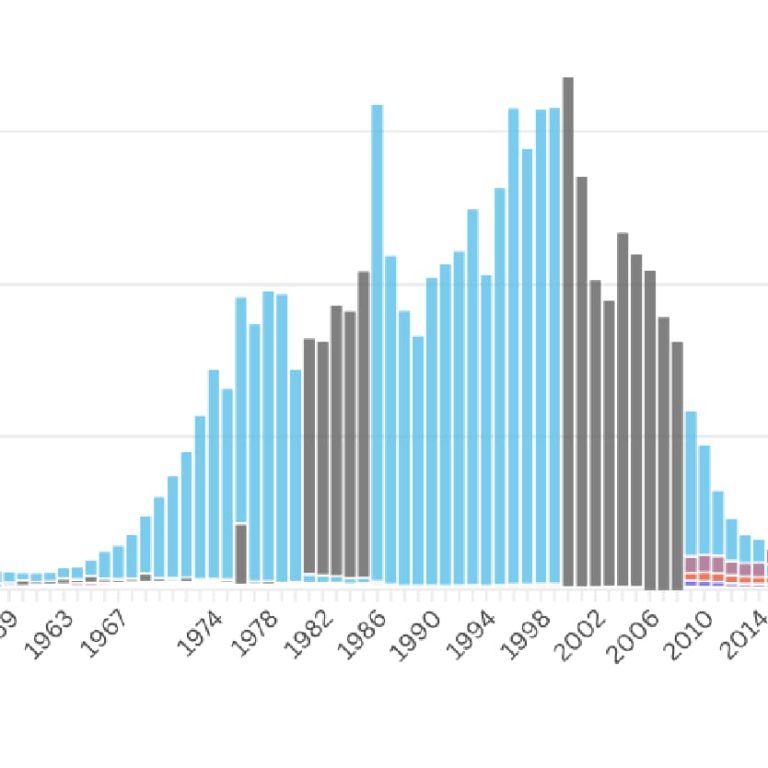
Deportations By Year
A Detailed Breakdown of Deportations by Year
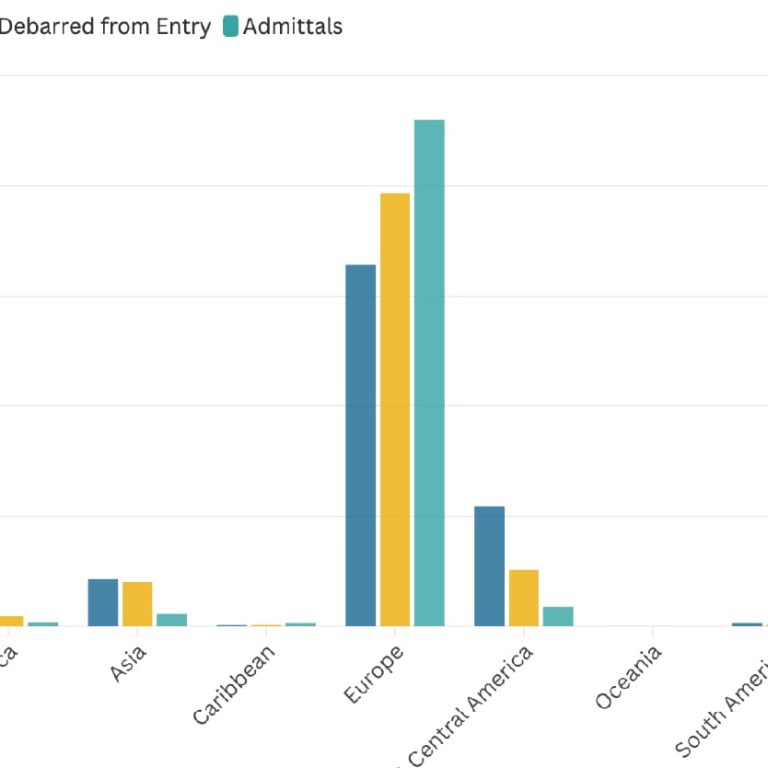
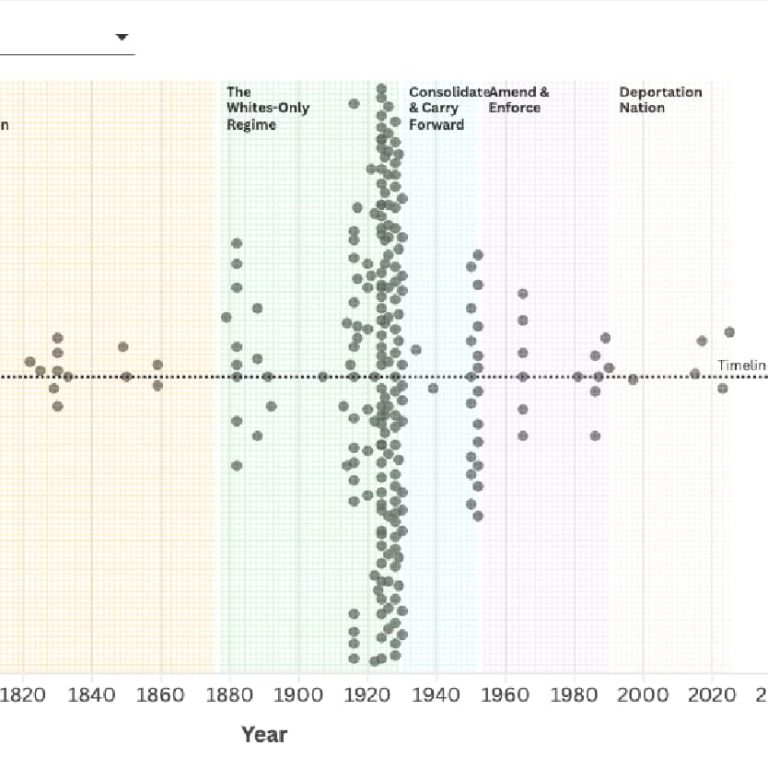
Beyond Deportation
The Many Ways U.S. Authorities have Expelled Immigrants since 1895
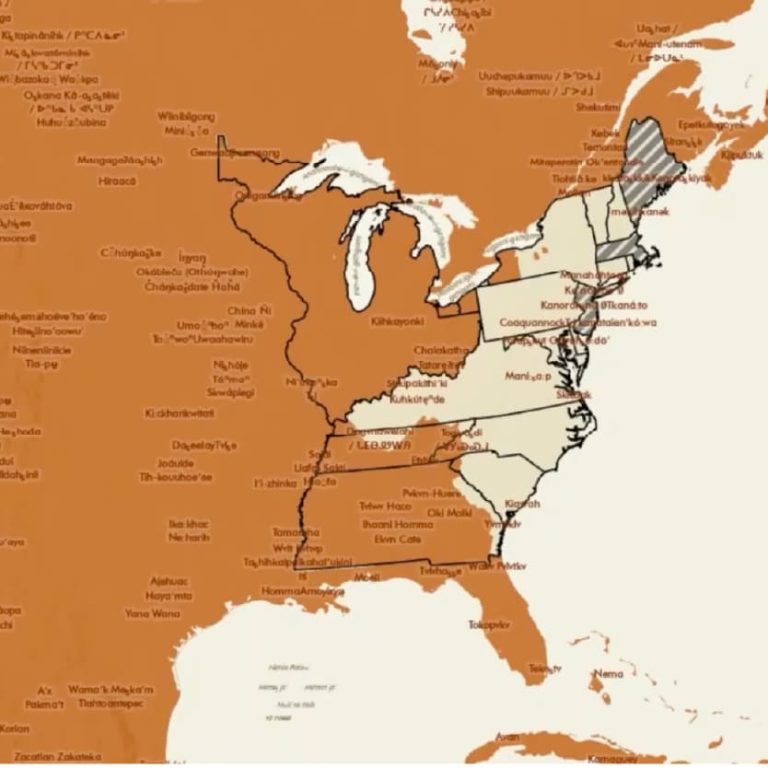
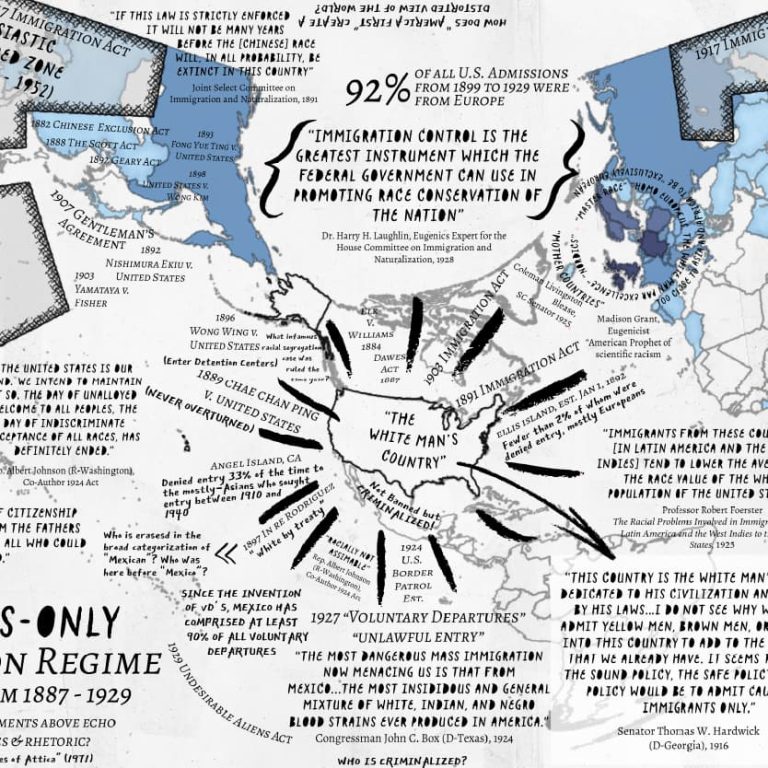
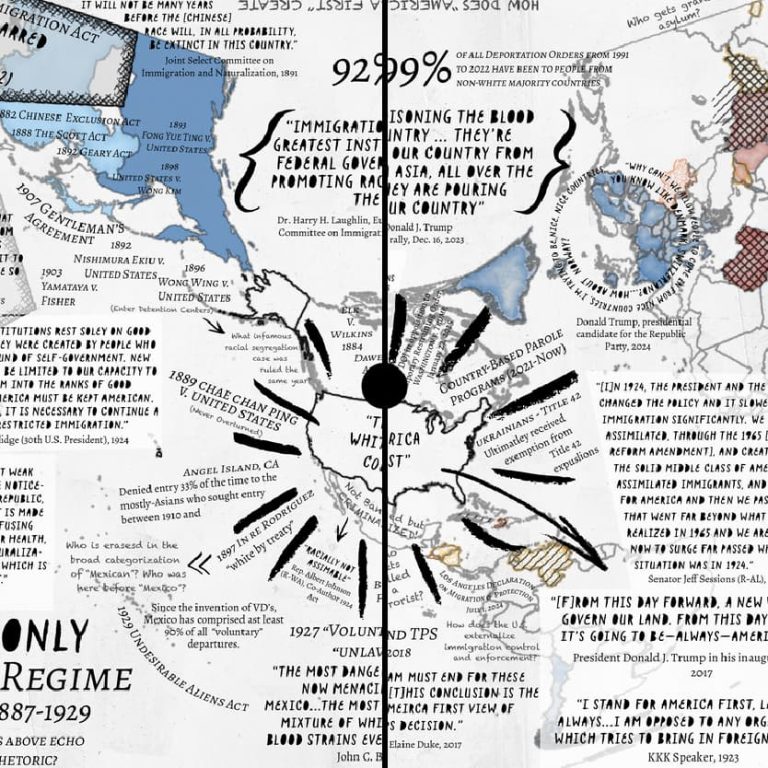
Mapping the “White Man’s Republic”
Indigenous Removal and Black Exclusion
The Whites-Only Immigration Regime
As Developed from 1887-1929
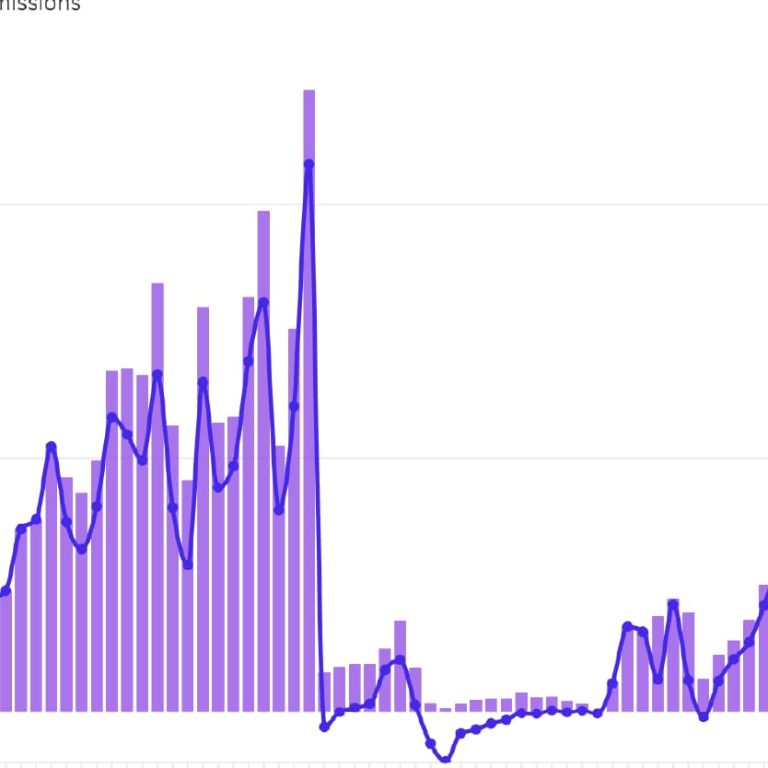
“Voluntary” Departures
Deportations + Voluntary Departures = 58 Million Removals
A Deeper Look
A Deeper Dive into Immigration Data from 1899–1929
Black Immigration: 1899-1961
For a Number of Years Net Black Migration was Negative
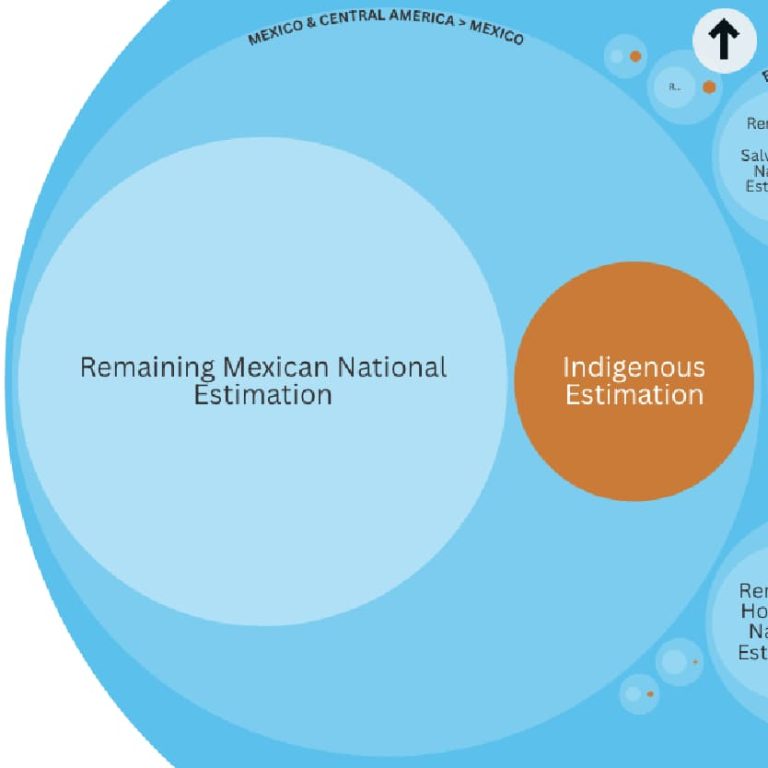
Hidden Data
Uncovering Indigenous Data Erasure in Deportation Datasets
Title 42 Expulsions
Race Discrimination Disguised as Public Health
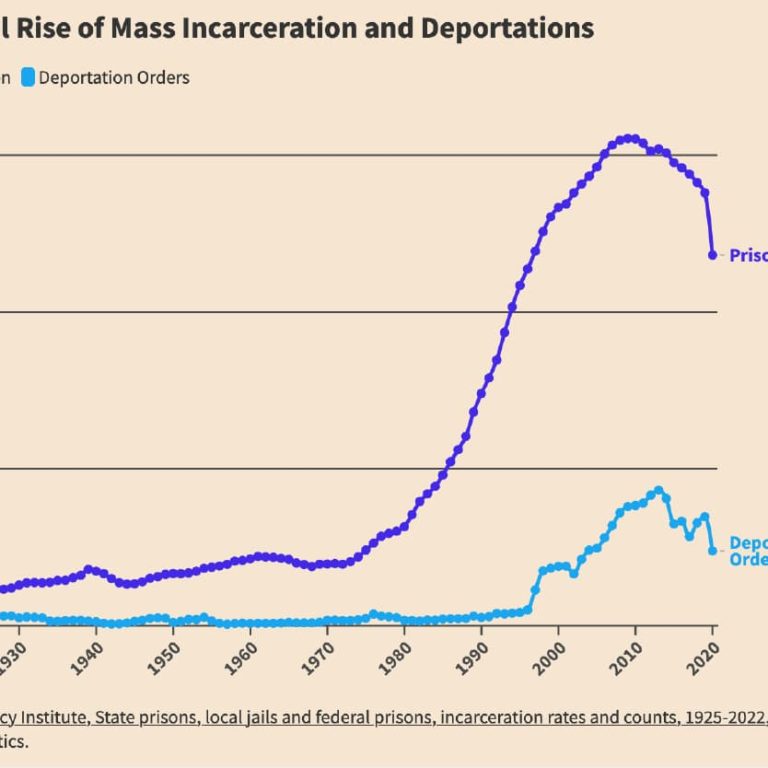
Mass Systems
The Parallel Rise of Mass Incarceration and Mass Deportation
In Their Own Words
The Words of Lawmakers and Leaders Throughout History
The Whites-Only Immigration Regime: Then & Now
Same Story. New Packaging.
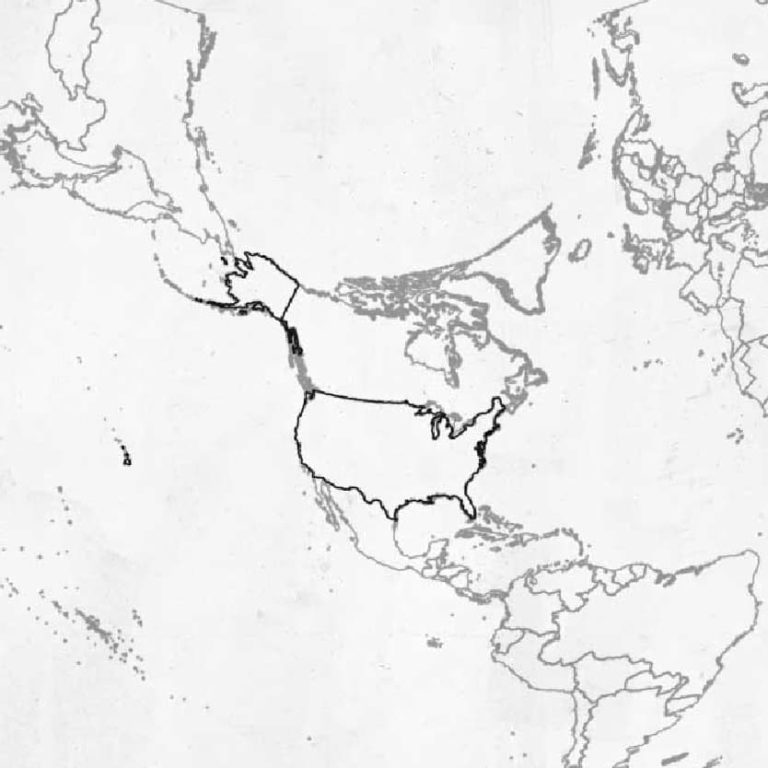
Make Your Own Map
A Blank Map to Draw Your Own Connections
A Future Where…
A Reimagining of Our Feature Map Played in Reverse