The Whites-Only Immigration Regime
As Developed from 1887-1929
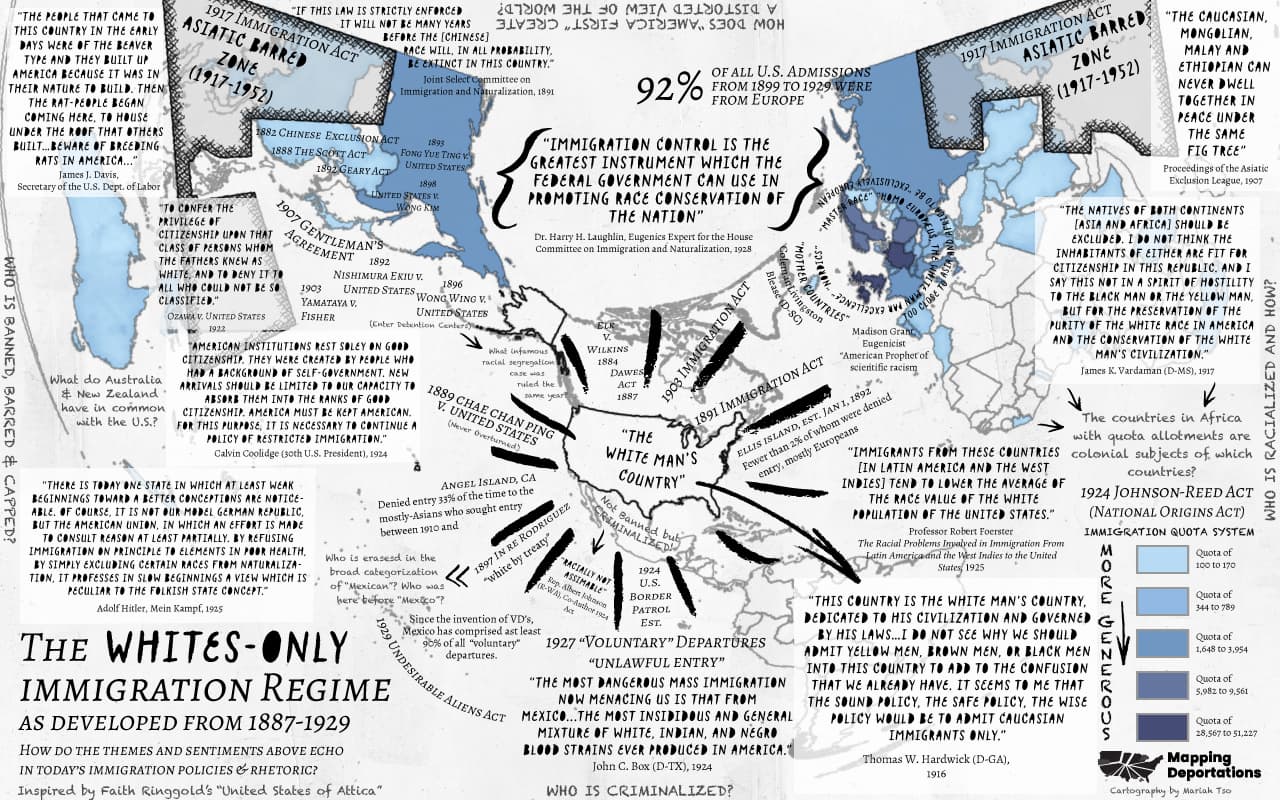
Immigration statistics are just one piece of the story. To better understand the full picture, we must look beyond statistical data to consider the statements of government officials, which can help us understand the government’s motivations at specific moments in time. Over time, government officials and advisors have repeatedly said what they wanted deportation to accomplish.
The map below was inspired by Faith Ringgold’s United States of Attica map (1971), which Ringgold made after the Attica prison rebellion. The United States of Attica depicts the sites and events of violence committed by the state or its citizens as handwritten notes over a map of the contiguous United States, with a note at the bottom of the map that invites viewers to make further additions to the map: “This map of American violence is incomplete, please write in whatever you find lacking.”
This map depicts the development of the Whites-Only Immigration Regime with quotes, policies, and data points from 1887–1929. Instead of a standard cardinal directions compass, four questions sit in the four medial intersections of the map. Starting at the top, situated upside-down reads “How does ‘America First’ create a distorted view of the world?”, next moving clockwise asks, “Who is racialized and how?”, then at the bottom, “Who is criminalized”, and lastly, “Who is banned, barred, & capped?” Just as a compass functions to provide navigational guidance and orientational context, these four questions are intended to guide the viewer in navigating both this map and the larger project of Mapping Deportations. Additional questions are peppered throughout the map. What other questions does this visualization make you want to ask?